Overview
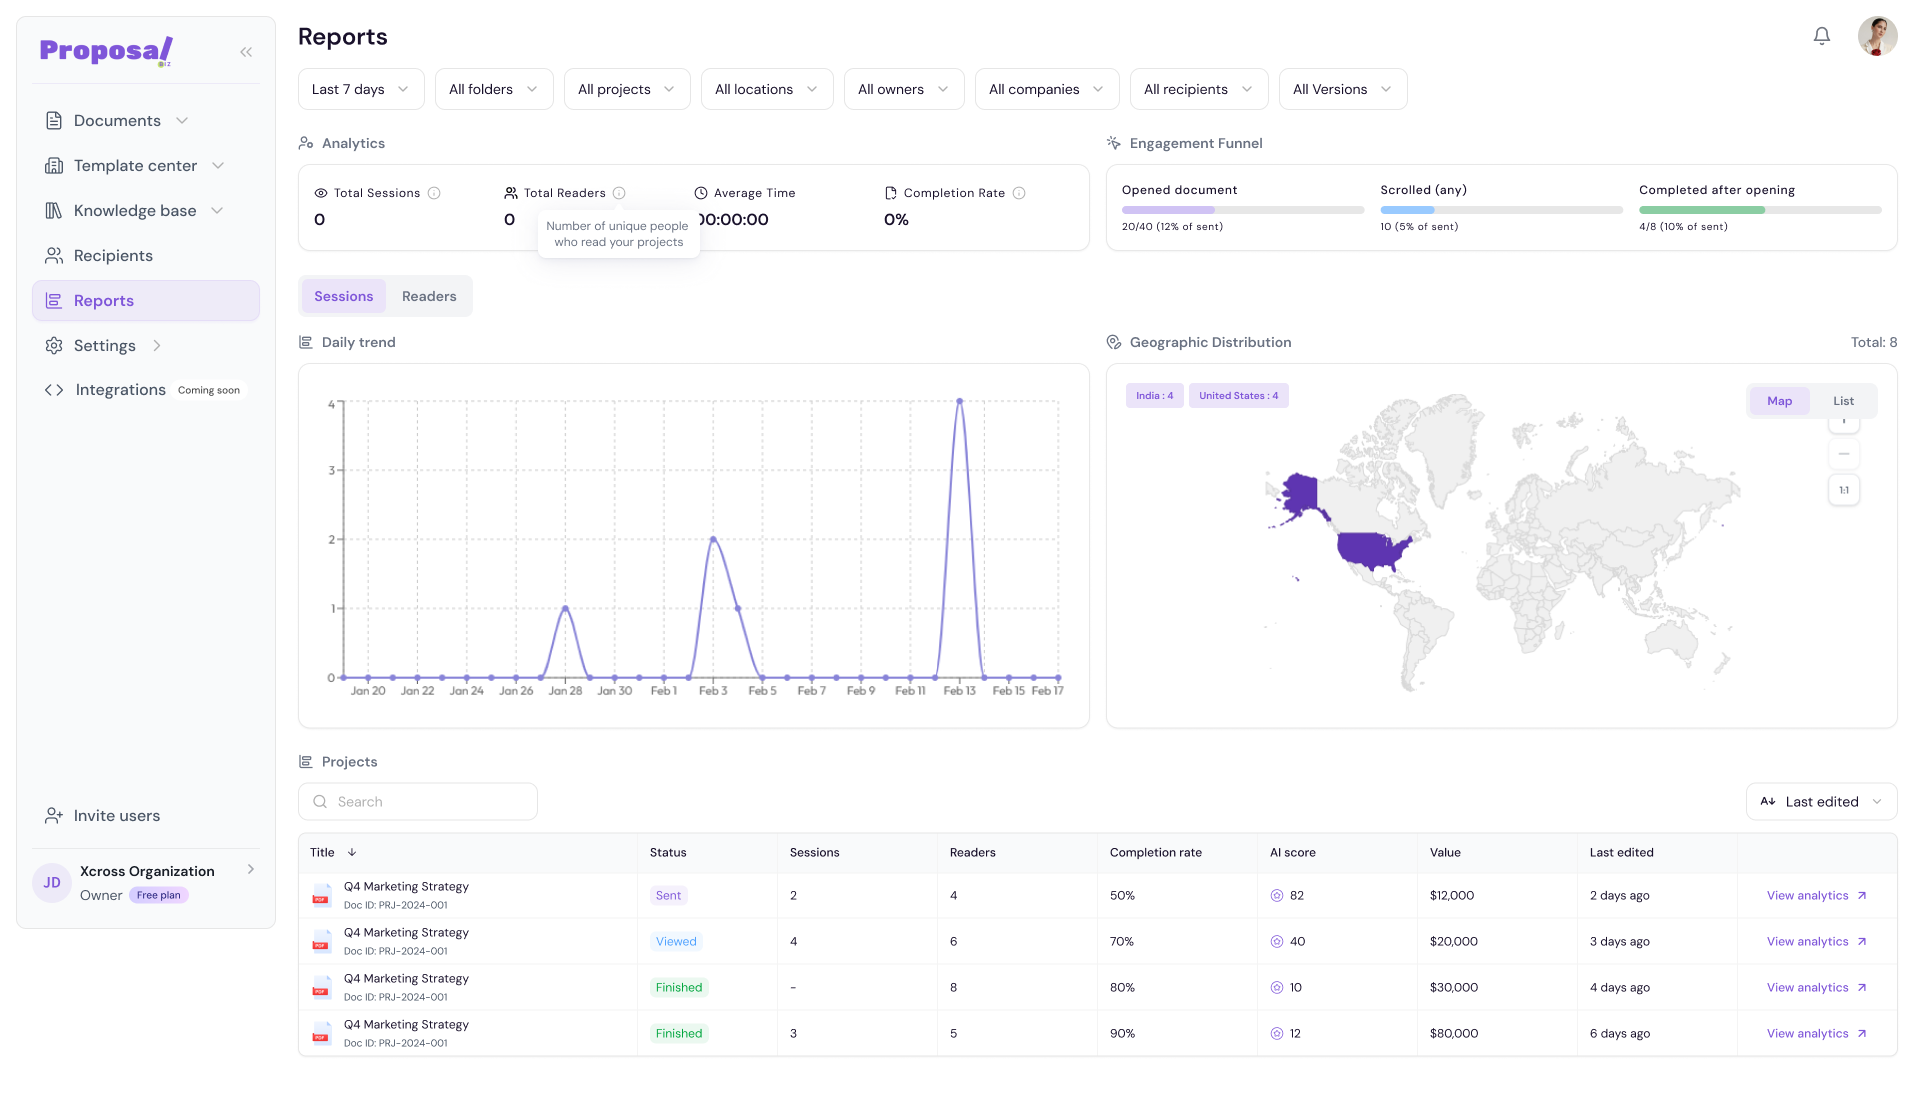
The Reports dashboard in Proposal.biz gives you full visibility into how your documents are performing. From high-level analytics across all your documents to detailed engagement data for individual documents. Reports helps you understand exactly how recipients interact with your content.
Accessing Reports
Go to Reports in the left sidebar
The Reports dashboard will open showing your workspace-wide analytics
Filtering Your Data
At the top of the Reports dashboard you will find a set of filters to narrow down your analytics:
Date range — Select a time period such as Last 7 days, Last 12 months, or a custom range
All Folders — Filter by document folder
All Documents — Filter by a specific document
All Locations — Filter by recipient location
All Owners — Filter by the team member who created the document
All Companies — Filter by company
All Recipients — Filter by a specific recipient
Reset — Clear all applied filters
Analytics Summary
The Analytics section displays four key metrics at a glance:
Total Sessions — Total number of times your documents have been viewed
Total Readers — Total number of unique readers across all documents
Average Time — Average time readers spend on your documents
Completion Rate — Percentage of readers who viewed the entire document
💡 Pro Tip Hover over each metric to see its definition in a tooltip. This is especially useful when sharing reports with team members who may not be familiar with the terminology.
Engagement Funnel
The Engagement Funnel shows how recipients progress through your documents:
Opened document — Number and percentage of recipients who opened the document out of total sent
Scrolled — Number and percentage of openers who scrolled through the document
Completed — Number and percentage of openers who viewed the document to completion
Sessions and Readers Tabs
Below the analytics summary you can switch between two views:
Sessions — Shows daily trend data based on total session activity
Readers — Shows daily trend data based on unique readers
Daily Trend
The Daily Trend graph is a line chart that shows document activity over time for the selected date range. Hover over any point on the graph to see the exact date and number of sessions or readers for that day.
Geographic Distribution
The Geographic Distribution section shows where your readers are located. You can toggle between two views:
Map — A world map with highlighted regions showing session distribution
List — A table showing each country with its total sessions and percentage
Documents Performance Table
Below the analytics and charts you will find a table listing all your documents with the following details:
Title — Document name and ID
Status — Current status (Sent, Expired, Finished, Draft)
Sessions — Number of viewing sessions
Readers — Number of unique readers
Completion rate — Percentage of readers who completed the document
AI score — AI evaluation score for the document
Value — Monetary value assigned to the document
Last edited — When the document was last updated
You can search for any document using the Search bar or sort by Last edited using the sort dropdown.
Next Steps Click on any document in the table to open its detailed analytics report. Learn more in Document-Level Analytics.